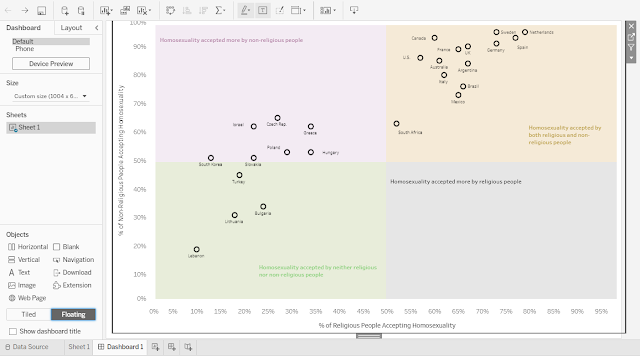
For this tutorial, I am going to show you how to create a quadrant chart on Tableau without the use of any illustrator tool (i.e. MS Paint, Photoshop, PowerPoint, etc.). This method is one that I have used in my viz for #MakeoverMonday 2020 W29 The global Divide on Homosexuality Persist. I think this is a less seen method compared to the other one seen here on Tableau website. This method is suitable for a fixed quadrant (i.e. 4 equal quadrants with the axis being 0 to 100%).
Step 1: Create your Scatter Plot.
- For information on how to do a scatter plot, read Tableau's tutorial here.
- Remember to set your axis to "0" to "1.01" so that "100%" will be shown.
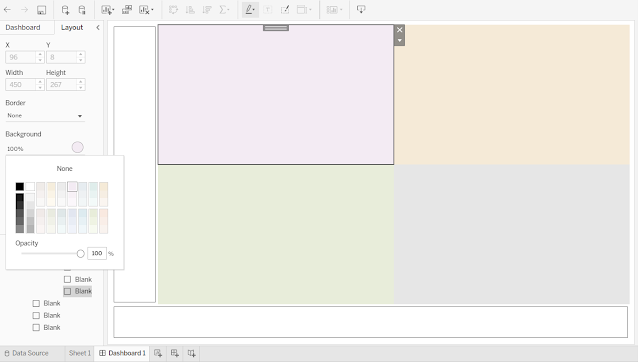
Step 2: Create 6 Blank Tiles
- Publish your Scatter Plot, as it is advisable to do the following portion of this tutorial on the browser itself using the "Edit" function on your browser. Otherwise, the format may differ when the viz is published.
- Create a new "Dashboard".
- Place your tiles like the picture below.
Step 3: Colour Your Tiles
- Go under "Layout".
- Edit the colour for each of the 4 tiles under "Background".
Step 4: Add in the Categories
- Under "Objects", select "Floating" and then select 'Text".
- Drag the text box to any place you will like the text to be.
- Type in the categories.
- Using the "Floating" function again, drag the scatter plot over the quadrants.
- Remember to set the background of your scatter plot to transparent. Tutorial here on Tableau's Community page.
Step 6: Publish Your Quadrant Chart!


