I have not seen this exact method of creating a proportional area square chart on Tableau shared widely. It may be because of the keywords I have used to Google (I have used the term in the title and "nested squares" at first). With that said, I found Toan Hoang's tutorials after I have done my 2021 Twitter Stats data viz. He has termed his chart, "Filled Square Charts". He offers 2 methods:
This method is similar to the one without using polygons with a couple of minor differences.
Step 1: Drag the Pills in Place
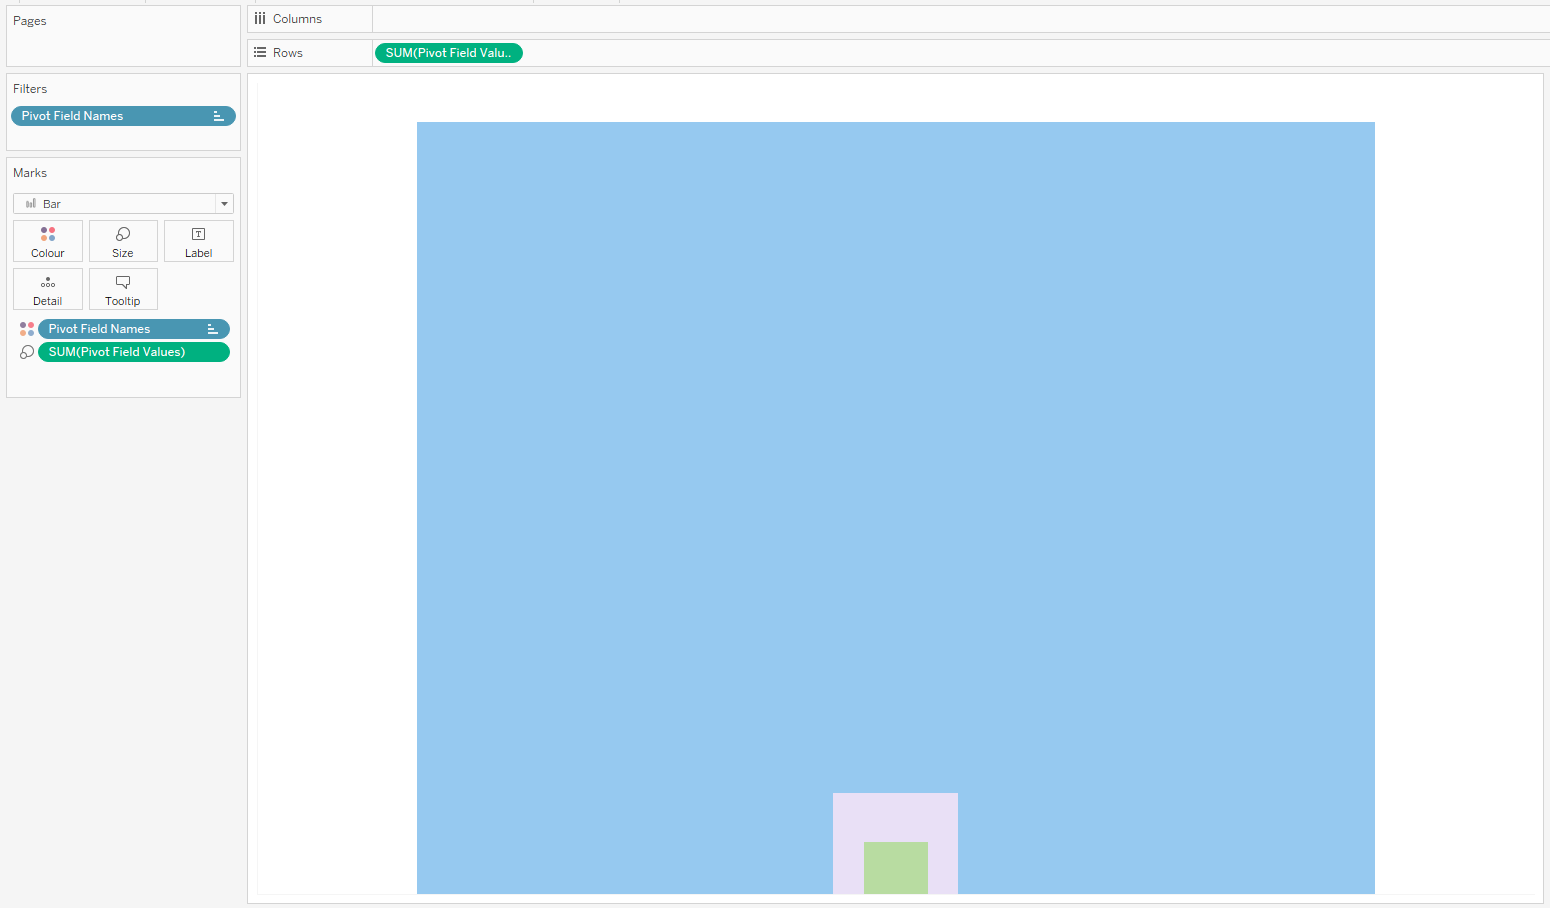
- "Values" goes to Rows and Size under Marks.
- "Names" goes to Colour.
- Change the Mark Type to Bar.
- Filter if needed.
- As you can see in the image below, you can stop here if you want the square to be centralised.
Step 2: Create Zero and Align the Squares
- To create "0" under Columns, double-click on Columns and type in "0".
- Adjust the Size to "Fixed" and Alignment to "Left"
Step 3: Publish Your 1-Side Proportional Area Square Chart!


