Summary
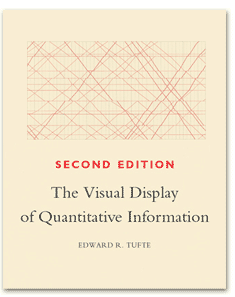
A classic as the Amazon website states. A data visualisation book recommendation by several articles. The first edition of this book may be first published in 1983, but much of the content in the book still holds true in today's data viz world. The book gives readers an introduction to what is considered good data viz through theories that are explained using apt examples. Terms introduced like lie-factor, graphical integrity, graphical excellence, data-ink, data density, and chartjunk set the theoretical foundation for data viz as a topic, which prompted more discussions on data viz as a field by others who come after him.
Things I like
1. It has real-world examples. The theories in the book are thoroughly demonstrated through vizzes collected from other published materials. It helps readers to understand what makes good vizzes that work with real-world data.
2. It is a book suitable for all vizzes tool users. With the first edition being published in the 80s, much less emphasis is placed on software but more on theories on how to make good vizzes. The tool-agnostic approach helps not only a professional dealing with data vizzes, but it also helps readers as the audience who consume data vizzes around us know that not all vizzes are what they seem to be; a second look can open our eyes to mistakes by the supposed professionals in data vizzes.
3. It acts almost like a checklist for people who perform data vizzes. Every chapter feels like an item on a checklist that readers can use to check after completing their data vizzes to ensure that their data vizzes are acceptable. As people who create data vizzes play the role of a designer and an analyst at the same time, the book serves as a reminder when the balance is lost.
Final Verdict: A classic that will bring readers into the world of data visualisation, beyond just chart types, through theories that can be applied to practical circumstances even today.
