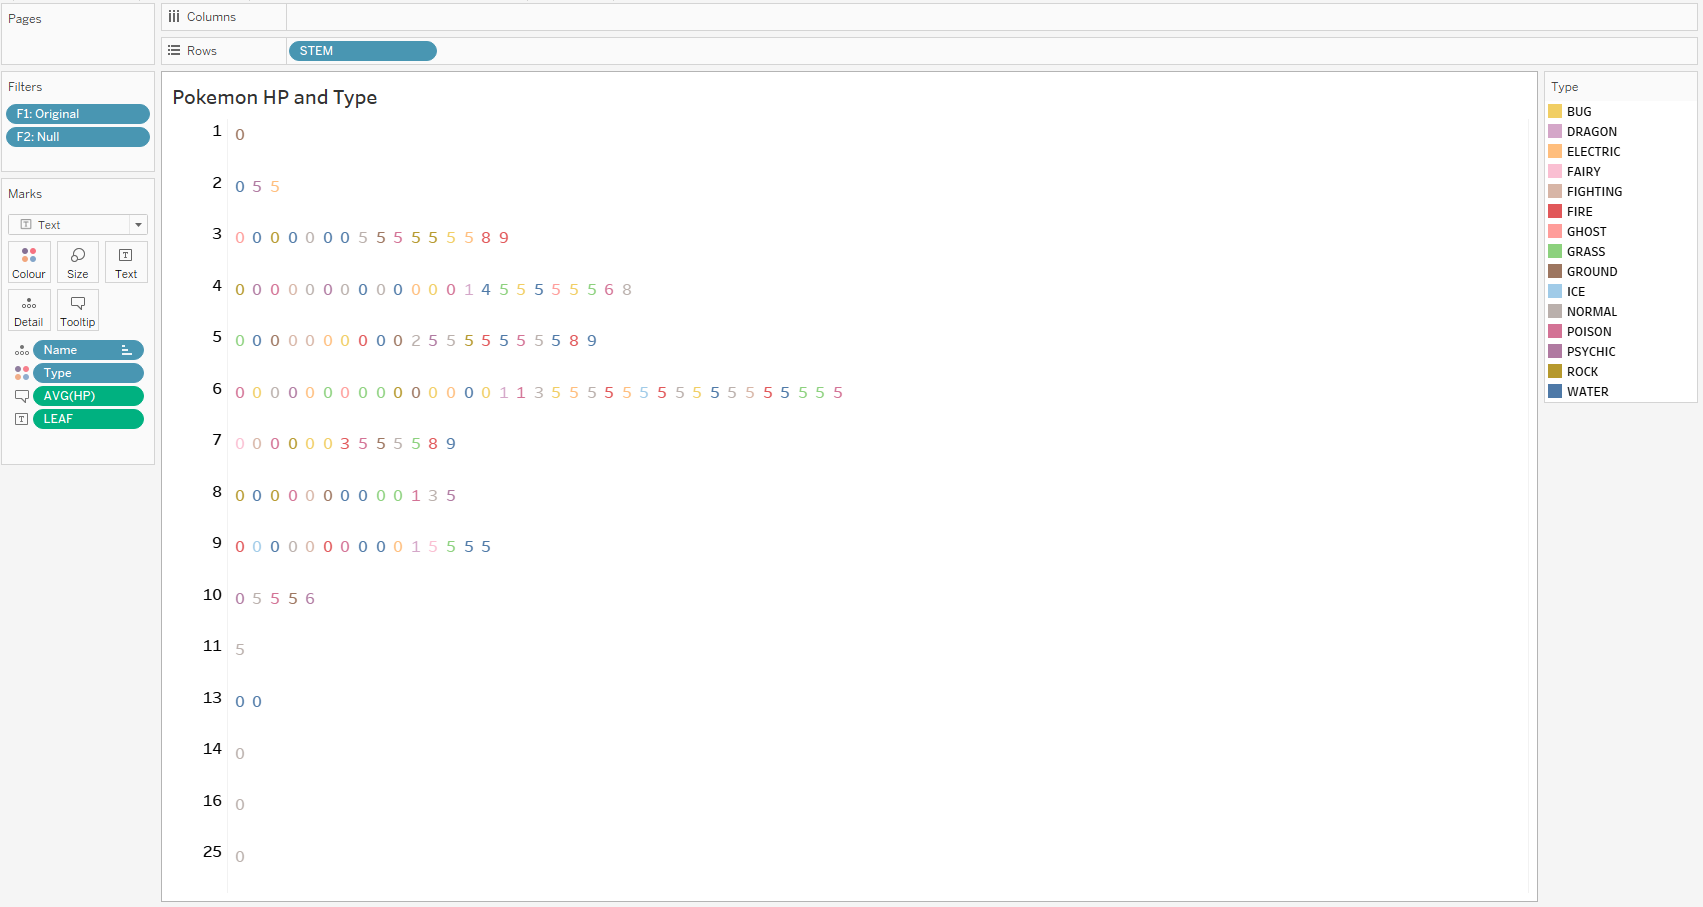
As far as I can tell, stem and leaf plots are rare sights among the Tableau community and other data viz communities these days. The stem and leaf plot seems to have become a thing of the past probably due to the lack of a "wow" factor and is probably more suitable for exploratory data analysis (EDA). Tufte explains the stem and leaf plot here on his website with an extract from his book, The Visual Display of Quantitative Information. Hence, I have decided to try to "beautify" the stem and leaf plot on Tableau as seen in the image above using a Pokemon dataset. A tutorial on how to create a stem and leaf plot on Tableau can also be seen here on YouTube. Below is a method that I have used that is quite similar. You can see the viz on Tableau Public here.
Step 1: Create Calculated Fields for Values
- To round the value, create a Calculated Field using the formula: ROUND([value], [decimals]).
- For the "Leaf" Calculated Field, input INT(RIGHT(STR([value]),1)) to draw out the last number.
- For the "Steam" Calculated Field, input INT(LEFT(STR([value]),(LEN(STR([value]))-1))). In short, this is to remove the final number for the leaf, so the LEN portion of the formula. The value also has to be turned into a string (STR) and back to an integer (INT) for the value to be manipulated.
Step 2: Place the Pills in their Places
- Follow the image below on where to place your pills.
- For the following example, I filtered some data with "F1" and "F2", so you may ignore them.
- Put "Stem" into Rows.
- Change Mark Type to Text using the dropdown box.
- Under Marks, put "Leaf" into Text.
- Also, put "Name" into detail and sort them by "Leaf" in ascending order.
- I am using "HP" as the [value] so I put it into the Tooltip.
Step 3: Beautify
- Drag the "Type" into Colour.
- Edit the Tooltip you deem fit.
Step 4: Publish Your Stem and Leaf Plot!


