This is a tutorial for Orbit Chart in Tableau my way. Admittedly, this chart may not be called an orbit chart at all, but it is definitely a type of pie/doughnut or radial chart. I am using the term because Toan Hoang has a tutorial on the same chart for Tableau. The method is similar to the radial charts in the previous 2 posts whereby I have used map layers to create it. Once you have understood how layers work, this will be easy. Read about map layers here on the Tableau website.
Step 1: Data Prep
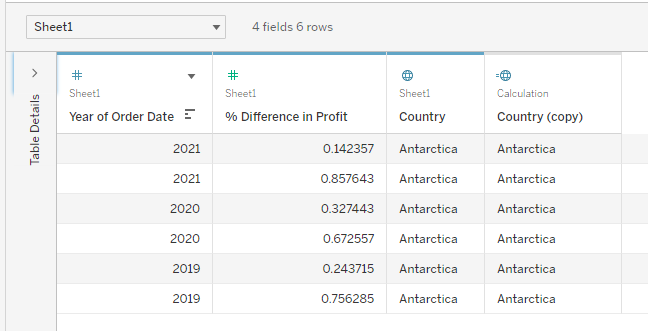
- Add 2 columns of dummy country to your ready dataset for ease of triggering the map in Tableau later (like below).
Step 2: Put in the Map Layers
- Insert your Longitude to Columns and Latitude to Rows.
- Click on Map Layers under Map then change the Washout to 100%.
- Add in 5 map layers using the Country column
Step 3: Remove Longitude from Columns and Latitude from Rows
Step 4: Adjust the Colour, Size, Detail, and Angle
- Follow the Marks in the following pictures.
Step 5: Publish Your Viz!
- Turn your background invisible and use the floating option to put the number over


