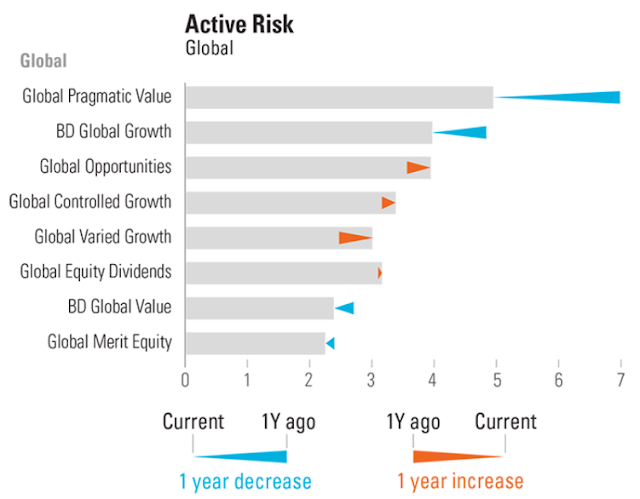
This post is inspired by the Bar Delta chart from Visualising Financial Data.
What is a Bar Delta?
A bar with an isosceles triangle attached to the end. The attached vertex indicates the same bar quantity, whereas the edge parallel to the bar end indicates another quantity. Simply put, it is a bar chart with triangles depicting increases and decreases between 2 periods (i.e. the delta).
My Chart Experiment
I am proposing a Coloured Bar Delta, as seen in the opening. Instead of triangles, the delta is illustrated using rectangles. Hence, the chart is a stacked bar chart of sorts, as triangles are harder to generate on Tableau, and possibly other applications.
Pro
- It is created with the stacked bar chart as a base, meaning it can be recreated easily with various visualising tools.
- The rectangles are easier to read and more familiar to viewers than the triangles on the chart. Else, more bar charts would have been made with triangles.
Con
- The delta cannot be easily differentiated as the chart will see as a stacked bar chart. This can be solved if the bars representing the latest values are marked with borders, although I have not found a way for this in Tableau yet. Borders are definitely a possibility in PowerPoint.
How to Create the Coloured Bar Delta in Tableau - My Way (Click on the image to see the image in full resolution)
Step 1: Create the Calculated Fields Needed
- I am using Sample Superstore dataset here with 2016 and 2017 as a comparison:
- MAX = MAX(SUM([2016]),SUM([2017]))
- MIN =MIN(SUM([2016]),SUM([2017]))
- COLOUR = IF SUM([2016])>SUM([2017]) THEN "DROP" ELSE "RISE" END
- Drag and drop the pill for the duration as Discrete to Rows
- Drag and drop the MAX and MIN pills into Columns
- Make the pills in Columns Dual Axis and then Synchronise Axis
- Drag and drop the COLOUR pill into Colour in the Marks card for MAX to choose the colours
- Make sure the Marks card is for Bar
Step 3: Publish your Coloured Bar Delta!
All in all, the Coloured Bar Delta is a simple yet effective chart. Despite it being based on a stacked bar chart, it does need a little help from the Bar Delta to see it in plain sight.


